
Reworking NBA.com's "Percentile" Column
Reworking NBA.com's "Percentile" Column
Putting confidence intervals on an overconfident metric

Percentiles are a generally useful way to think about a stat. They instantly give context to a number. Is a player scoring 1.0 points per possession on isolation shots good in isolation? That’s 76th percentile. There are two issues with using percentiles though:
Percentiles disregard the distribution of the statistic. For example, if nearly every player in the league scores between 0.99-1.01 points per possession on isolation plays, then the difference between the 20th and 80th percentile doesn’t matter. But maybe a few players score 1.4 points per possession on isolation plays. Then the difference between 95th and 98th percentiles is huge. If you only look at the percentile, these subtleties are lost.
They’re noisy.
Here, we’re going to focus on how percentiles are a noisy metric.
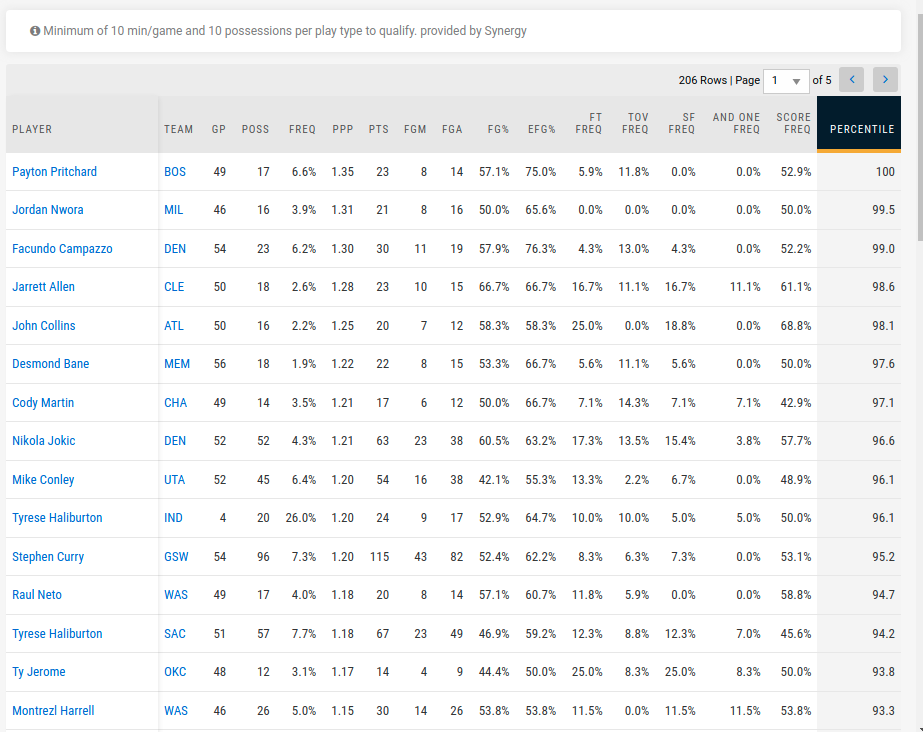
If you look at who’s the highest percentile on isolation shots on NBA.com (screenshot above), it’s Payton Pritchard. Jordan Nwora comes in second. That can’t be right.
Percentiles are exceptionally noisy for two reasons:
Any individual player has only taken a handful of isolation shots, so it’s hard to get a reasonable estimate of how good a player is at isolation shots. NBA.com uses a threshold of at least 10 isolation shots per player, but this is hacky and doesn’t really help.
Even if you could get a perfect estimate on a single player’s isolation shot ability, percentile is a relative metric. So let’s say you knew LeBron James made exactly 1.1 points per possession on isolation shots. It’s still hard to put a precise percentile on him when there’s so much uncertainty on how well every one else is shooting on isolation shots.
We used a model that estimates player isolation shot ability to try to get an understanding of how much uncertainty there is in percentile values. This allows us to put confidence intervals1 on the percentile value for each player.
The full model is at the bottom of this post, but it estimates each player’s points per possession on isolation shots using a hierarchical Poisson regression model that accounts for how many shot attempts each player has played. So if a player has only taken 5 isolation shot attempts and made all 5 of them, it looks around the league and says that the player probably got lucky. But if a player made 28 out of 30, that’s probably enough evidence that the player is really good in isolation.
Let’s start by comparing a couple players to get a sense of what the model is doing.
NBA.com has DeMar DeRozan at 91st percentile on 241 isolation possessions. Kevin Love is at 13th percentile on 26 isolation possessions. If you look at our model’s estimates of DeRozan’s and Love’s percentiles, it tells a slightly different story:
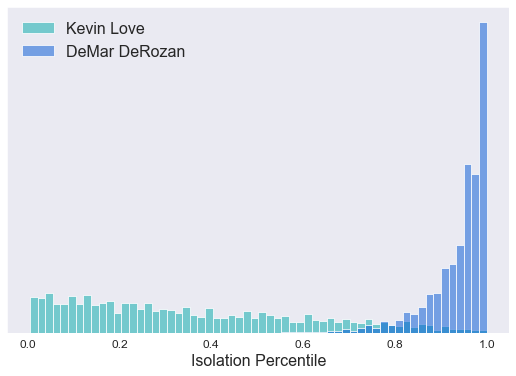
There’s so much data on DeMar DeRozan in isolation, that the model is fairly certain he’s >90th percentile. He’s probably even >95th percentile. Kevin Love, on the other hand, has only taken a handful of isolation shots. So really, he could be anywhere from the worst in the league to around 80th percentile. It’s just hard to say on only 26 isolation possessions.
Here’s another interesting example: Julius Randle has taken 272 isolation shots this season. That’s a lot, but here’s what the model thinks about his percentile:
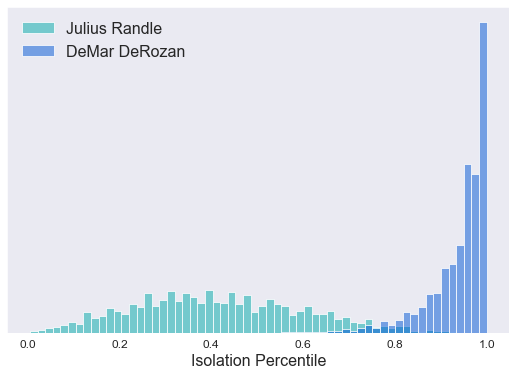
The model is more certain about Randle’s percentile than Love’s, but there’s still huge uncertainty in Randle’s percentile. What’s going on here? The model is actually fairly certain in Randle’s isolation ability because there’s so much data on him. But there are so many other players with just a handful of isolation shots that the model doesn’t know where to put him. For example, Kevin Love might be better than Randle, but we just don’t know because we haven’t seen enough from Kevin Love this season.
The takeaway is that a single percentile value for each player in incredible noisy.
Looking across the league, our model gives a percentile estimate and confidence intervals for each player. Here are our model’s highest and lower percentile players.
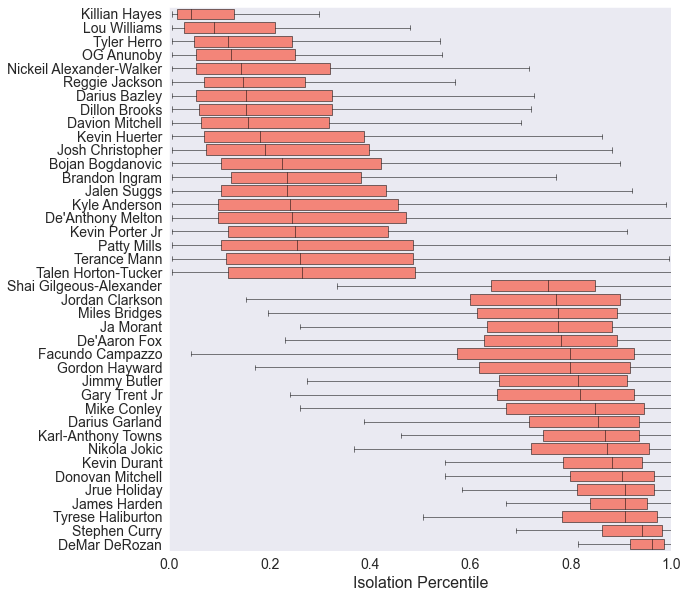
Even at the upper and lower extremes, those confidence intervals are pretty dramatic.
Percentiles are useful to provide context to a stat, but it’s good to keep in mind the uncertainty in their values.
Looking Ahead
I spent so much time thinking about modeling percentiles, that I shouldn’t move on so quickly after just looking at isolation plays. But at the same time, I have another idea I’ve been meaning to look at:

Model
Here’s the full model. It’s a hierarchical Poisson model. I had a persistent bug while working on it, and while trying to fix the bug I ended up making a variety of improvements. For example, I used poisson_log directly instead of coding it myself. And I made the hierarchical parameter’s mean 0.
data {
    int<lower=0> n_players;
    int n_poss[n_players];
    int n_points[n_players];
    int y;
}

parameters {
    real lambda[n_players];
    real alpha;
    real<lower=0> lambda_sigma;
}

model {
    lambda_sigma ~ cauchy(0, 5);
    alpha ~ normal(0, 10);

    for (player in 1:n_players) {
        lambda[player] ~ normal(0, lambda_sigma);
        n_points[player] ~ poisson_log(log(n_poss[player]) + alpha + lambda[player]);
    }
}

generated quantities {
   int y_hat;
   int n_points_hat[n_players];
   real ppp[n_players];

   y_hat = 5;
   for (player in 1:n_players) {
        n_points_hat[player] = poisson_log_rng(log(n_poss[player]) + alpha + lambda[player]);
        ppp[player] = n_points_hat[player] * 1.0 / n_poss[player];
   }
}At some point in my life, I decided to called credible intervals confidence intervals. If the person you’re talking to knows the difference, they’re knowledgeable to understand that you wouldn’t go through the process of using a fully Bayesian model just to report confidence intervals. And if the person you’re talking to doesn’t know the difference, then there’s no need to get bogged down in the details.