
Defensive Modeling, part 1
Defensive Modeling, part 1
Which teams jam up offensives?

In our game prediction model, a key component is the defensive strength of each team. Currently, we’re taking a holistic approach that learns a single value for the strength of each team, and also includes player-specific defensive strengths. In this infinite-part series, we’re going to take incremental steps to incorporate various aspects of defense into our model. Here, we start by looking at how strong each team is at preventing assisted shots.
At a high level, our model looks at each game so far in the season and estimates the strength of each team in generating assists and the strength of each team in preventing assists.
Looking at all 30 teams, here is how many assists each team is likely to prevent per game (relative to league average).
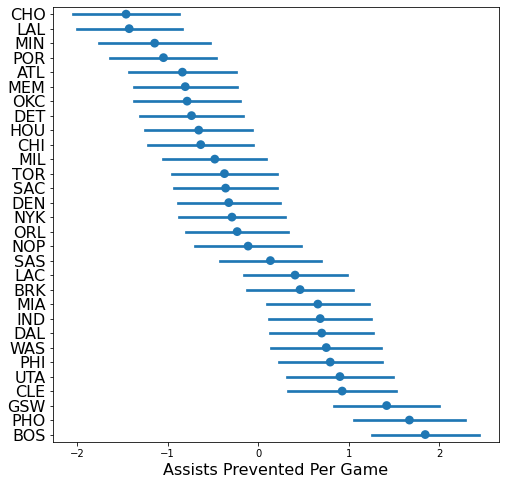
As usual, the we’re keeping track of uncertainty in the model. The error bars give a sense of how certain the model is.
One way to think about this plot is to look at a team like Boston who was a score of 2. If Boston were to play a team that usually generates 10 assists, Boston would likely limit them to 8 assists.
Looking at the error bars, it’s easy to group the teams into 4 tiers:
Top Tier: Golden State, Phoenix, and Boston all prevent more than 1 assist per game.
Good Tier: All the teams between the Clippers and Cleveland are better than league average at preventing assists.
Middle Tier: From Minnesota to San Antonio, these teams don’t prevent assists, but they don’t really give up many extra assists either.
Bottom Tier: Charlotte and the Lakers give up a lot of assists.
As a by-product of the model, we also had to estimate how well each team is at generating extra assists (relative to league average). Those results are shown in the plot below.
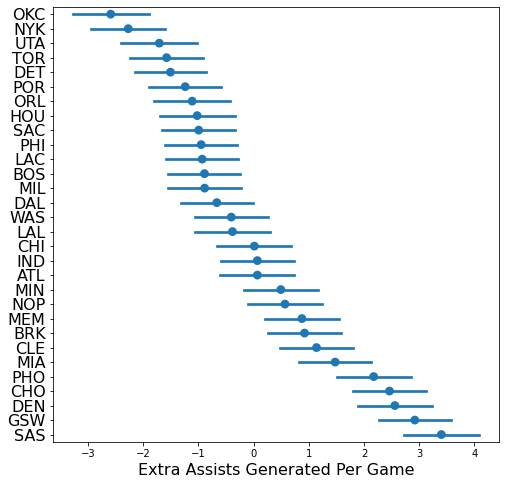
One thing to notice is the spread between top teams and bottom teams is much greater when comparing offense to defense. The top offensive team can generate an extra 3.5 assists per game, while the top defensive team can only prevent 2 assists per game. This is in line with the general idea that there is more variance in team offenses than defenses, which has been extensively documented.
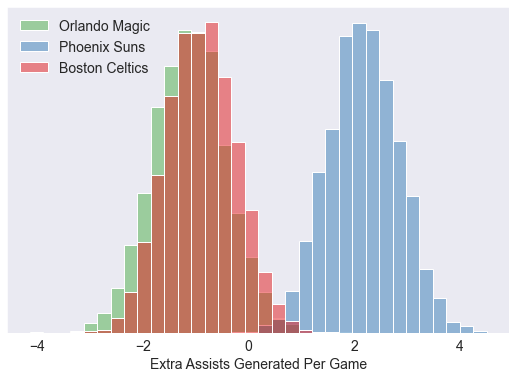
These plots above can easily be misinterpreted. We’ll use three teams as an example: Orlando Magic, Phoenix Suns, and Boston Celtics. Returning to the first plot on how well each team prevents assists, you might say Boston is the best defensive team. But that wouldn’t be a sound conclusion. If you look at the uncertainty in the model, the model basically gives a 50-50 chance of Phoenix being better than Boston. In contrast, both of those teams are better than a middle-of-the-pack team like the Magic.

On offense, it’s a different story. Phoenix is the clear winner in generating extra assists, while the model can’t distinguish between Boston and Orlando.
Home Court Advantage?
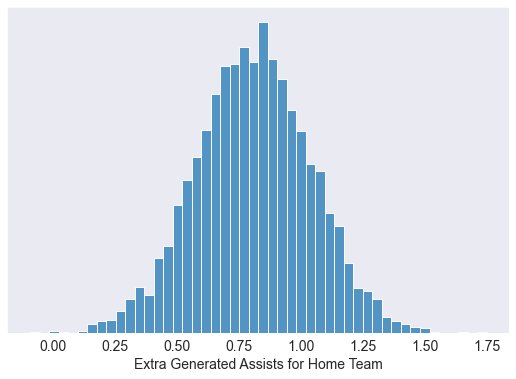
Another by-product, our model also estimates how much home court advantage is worth when it comes to assisting. Incredibly, home court advantage gets you nearly one extra assist. And the model is fairly sure of this: the home team generates some where around an extra 0.5-1.25 assists from home court advantage.
Looking ahead
I took the last two weeks off from fiddling with my models. I was trying to ramp up my running mileage, which was literally taking all of my free time (and some of my non-free time). In an effort to prevent an injury, I’m going to dial it back for the next few weeks. So now, I have the engineering completed to look at various defensive models like the one in this post. I’ll probably explore those for a bit, unless I get distracted with other ideas I have bouncing around.
Stan Model
You can stop reading. This section is only for people curious about the underlying probability model. Either because they want to understand the details or they want to expand on it themselves. The model is a hierarchical model on team assists.
data {

    //----------------------------------------//
    // Historical game data                   //
    //----------------------------------------//

    int<lower=0> n_games;
    int<lower=0> n_teams;
    int<lower=0>away_teams[n_games];
    int<lower=0>home_teams[n_games];
    real<lower=0>away_score[n_games];
    real<lower=0>home_score[n_games];
}

parameters {

    //----------------------------------------//
    // Team performance parameters            //
    //----------------------------------------//
    real home_advantage;
    real <lower=0> sigma;
    real<lower=0> alpha;
    vector[n_teams] team_offense;
    real<lower=0> team_offense_sigma_bar;
    vector[n_teams] team_defense;
    real<lower=0> team_defense_sigma_bar;
}


model {
    //----------------------------------------//
    // Priors                                 //
    //----------------------------------------//
    team_offense_sigma_bar ~ cauchy(0, 5);
    team_offense ~ normal(0, team_offense_sigma_bar);
    team_defense_sigma_bar ~ cauchy(0, 5);
    team_defense ~ normal(0, team_defense_sigma_bar);
    sigma ~ cauchy(0, 5);
    home_advantage ~ normal(0, 5);

    //----------------------------------------//
    // Model                                  //
    //----------------------------------------//

    for(game in 1:n_games) {
        home_score[game] ~ normal(alpha +
                                  home_advantage +
                                  team_offense[home_teams[game]] -
                                  team_defense[away_teams[game]],
                                  sigma);
        away_score[game] ~ normal(alpha +
                                  team_offense[away_teams[game]] -
                                  team_defense[home_teams[game]],
                                   sigma);
    }

}